CARBON FOOTPRINT & CLIMATE CHANGE
As a rapidly growing industry with a large land footprint, palm oil producers have an important role to play in reducing greenhouse gas (GHG) emissions and limiting the environmental and socioeconomic risks posed by climate change. REA seeks to make a material contribution towards this common goal.
REA has developed an implementation roadmap framed by a series of principles and procedures to evaluate and address climate-related risks and opportunities related to the group’s business and the wider community. These principles and procedures aim to deliver regeneration through driving positive change, enhancing biodiversity and environmental protection, and providing opportunities for stakeholder prosperity.
REA has made a commitment to achieve a 50 per cent reduction in net GHG emissions (as defined under SECR below) by 2030 and to work towards the longer term objective of net-zero emissions by 2050. To this end, the group has signed up to the SBTi, an international, cross-industry framework aimed at promoting corporate adoption and disclosure of verified, science-based targets concerning decarbonisation. Under this framework, the group will be setting verified short and medium term emission reduction targets which will be published and against which the group must report on an agreed schedule.
REA has developed work programmes and initiatives based on the need to adapt and thrive in the face of risks and opportunities presented by ESG including climate change. If, as is projected, rainfall becomes increasingly intense during the wet seasons, infrastructure must be less flood-prone and more weather resistant. This requires investment in road-stoning, drainage and water management. If, as is also predicted, weather conditions become increasingly hot during the dry seasons, water stewardship will become increasingly challenging. REA continues to explore project opportunities aimed at increasing the resilience of the estate soils to both absorb and store increasing amounts of water and nutrients to help buffer the projected increasing weather variability. These projects include collaboration with researchers and commercial interests to develop methodologies for optimising the use of mill waste products, such as EFB and other sources of organic matter and nutrients for organic fertiliser. Such collaborations include supporting research by the University of Mulawarman into the prevention of oil palm diseases, the conversion of mill waste into proteins using black soldier fly larvae, the use of fibre for toothbrushes and other projects to foster a circular economy in palm oil production.
REA publishes emissions data under three methodologies: the RSPO mandated PalmGHG tool, ISCC and the UK Government Streamlined Energy and Carbon Reporting (SECR) framework.
Whilst the methodology for calculating emissions under SECR is identical to that used for RSPO, the scope of activities covered is different. RSPO requires only the GHG emissions from the group’s palm oil mills and their supply bases to be included. Emissions linked to REA’s estates that do not yet supply FFB to one of REA’s mills are not included. Instead, emissions associated with the land use change component of new oil palm developments (which represent the majority of emissions from new developments) are accumulated over the immaturity period of each development and then amortised over the 25 year oil palm lifecycle once the development starts producing crop. The scope of emissions reported under SECR, however, includes all group activities worldwide and thus includes emissions from new developments as these arise, but excludes the amortisation of emissions accumulated during the development of areas now in production. Except where otherwise stated, the PalmGHG methodology, adjusted for this different basis, has been used for the calculations. Going forward, REA intends to adopt the now widely accepted international GHG Corporate Standard for calculating and reporting the group’s GHG emissions although the PalmGHG tool may continue to be used for the purposes of certification schemes for palm oil.
Streamlined energy and carbon reporting (SECR) framework
The scope of current emissions and energy usage reported under SECR includes those associated with all group activities worldwide irrespective of where these arise. These are designated as Scope 1 (emissions from group owned or controlled sources) and Scope 2 (indirect emissions from the generation of purchased electricity, steam, heating and cooling consumed by the group). Scope 3 (indirect emissions within the group value chain) are not currently included in the report.
| 2023 | 2022 | |
| Gross emissions (tCO2eq) | ||
| Oil palm cultivation in Indonesia1 | 452,809 | 480,912 |
| Manufacture, transport and use of fertilisers2 | 69,387 | 49,872 |
| Subtotal | 522,196 | 530,784 |
| Collection, milling and distribution operations in Indonesia3 | 106,573 | 100,578 |
| Electricity purchased for own use4 | 79 | 79 |
| Global emissions | 628,848 | 631,441 |
| UK emissions included within global emissions | 17 | 17 |
| Net emissions (tCO2eq) | ||
| Oil palm cultivation in Indonesia1 (including manufacture, transport and use of fertilisers2) | 67,100 | 39,997 |
| Collection, milling and distribution operations in Indonesia3 | 53,556 | 35,773 |
| Electricity purchased for own use4 | 79 | 79 |
| Global emissions | 120,735 | 75,848 |
| UK emissions included within global emissions | 17 | 17 |
| Energy usage (kWh) ('000) | ||
| Combustion of fuel | 96,968 | 85,416 |
| Methane capture generated electricity | 17,933 | 17,520 |
| Purchased electricity | 75 | 75 |
| Global energy use | 114,976 | 103,011 |
| UK energy use included within global energy use | 10 | 16 |
| Intensity measures (tCO2eq/tonne CPO)5 | ||
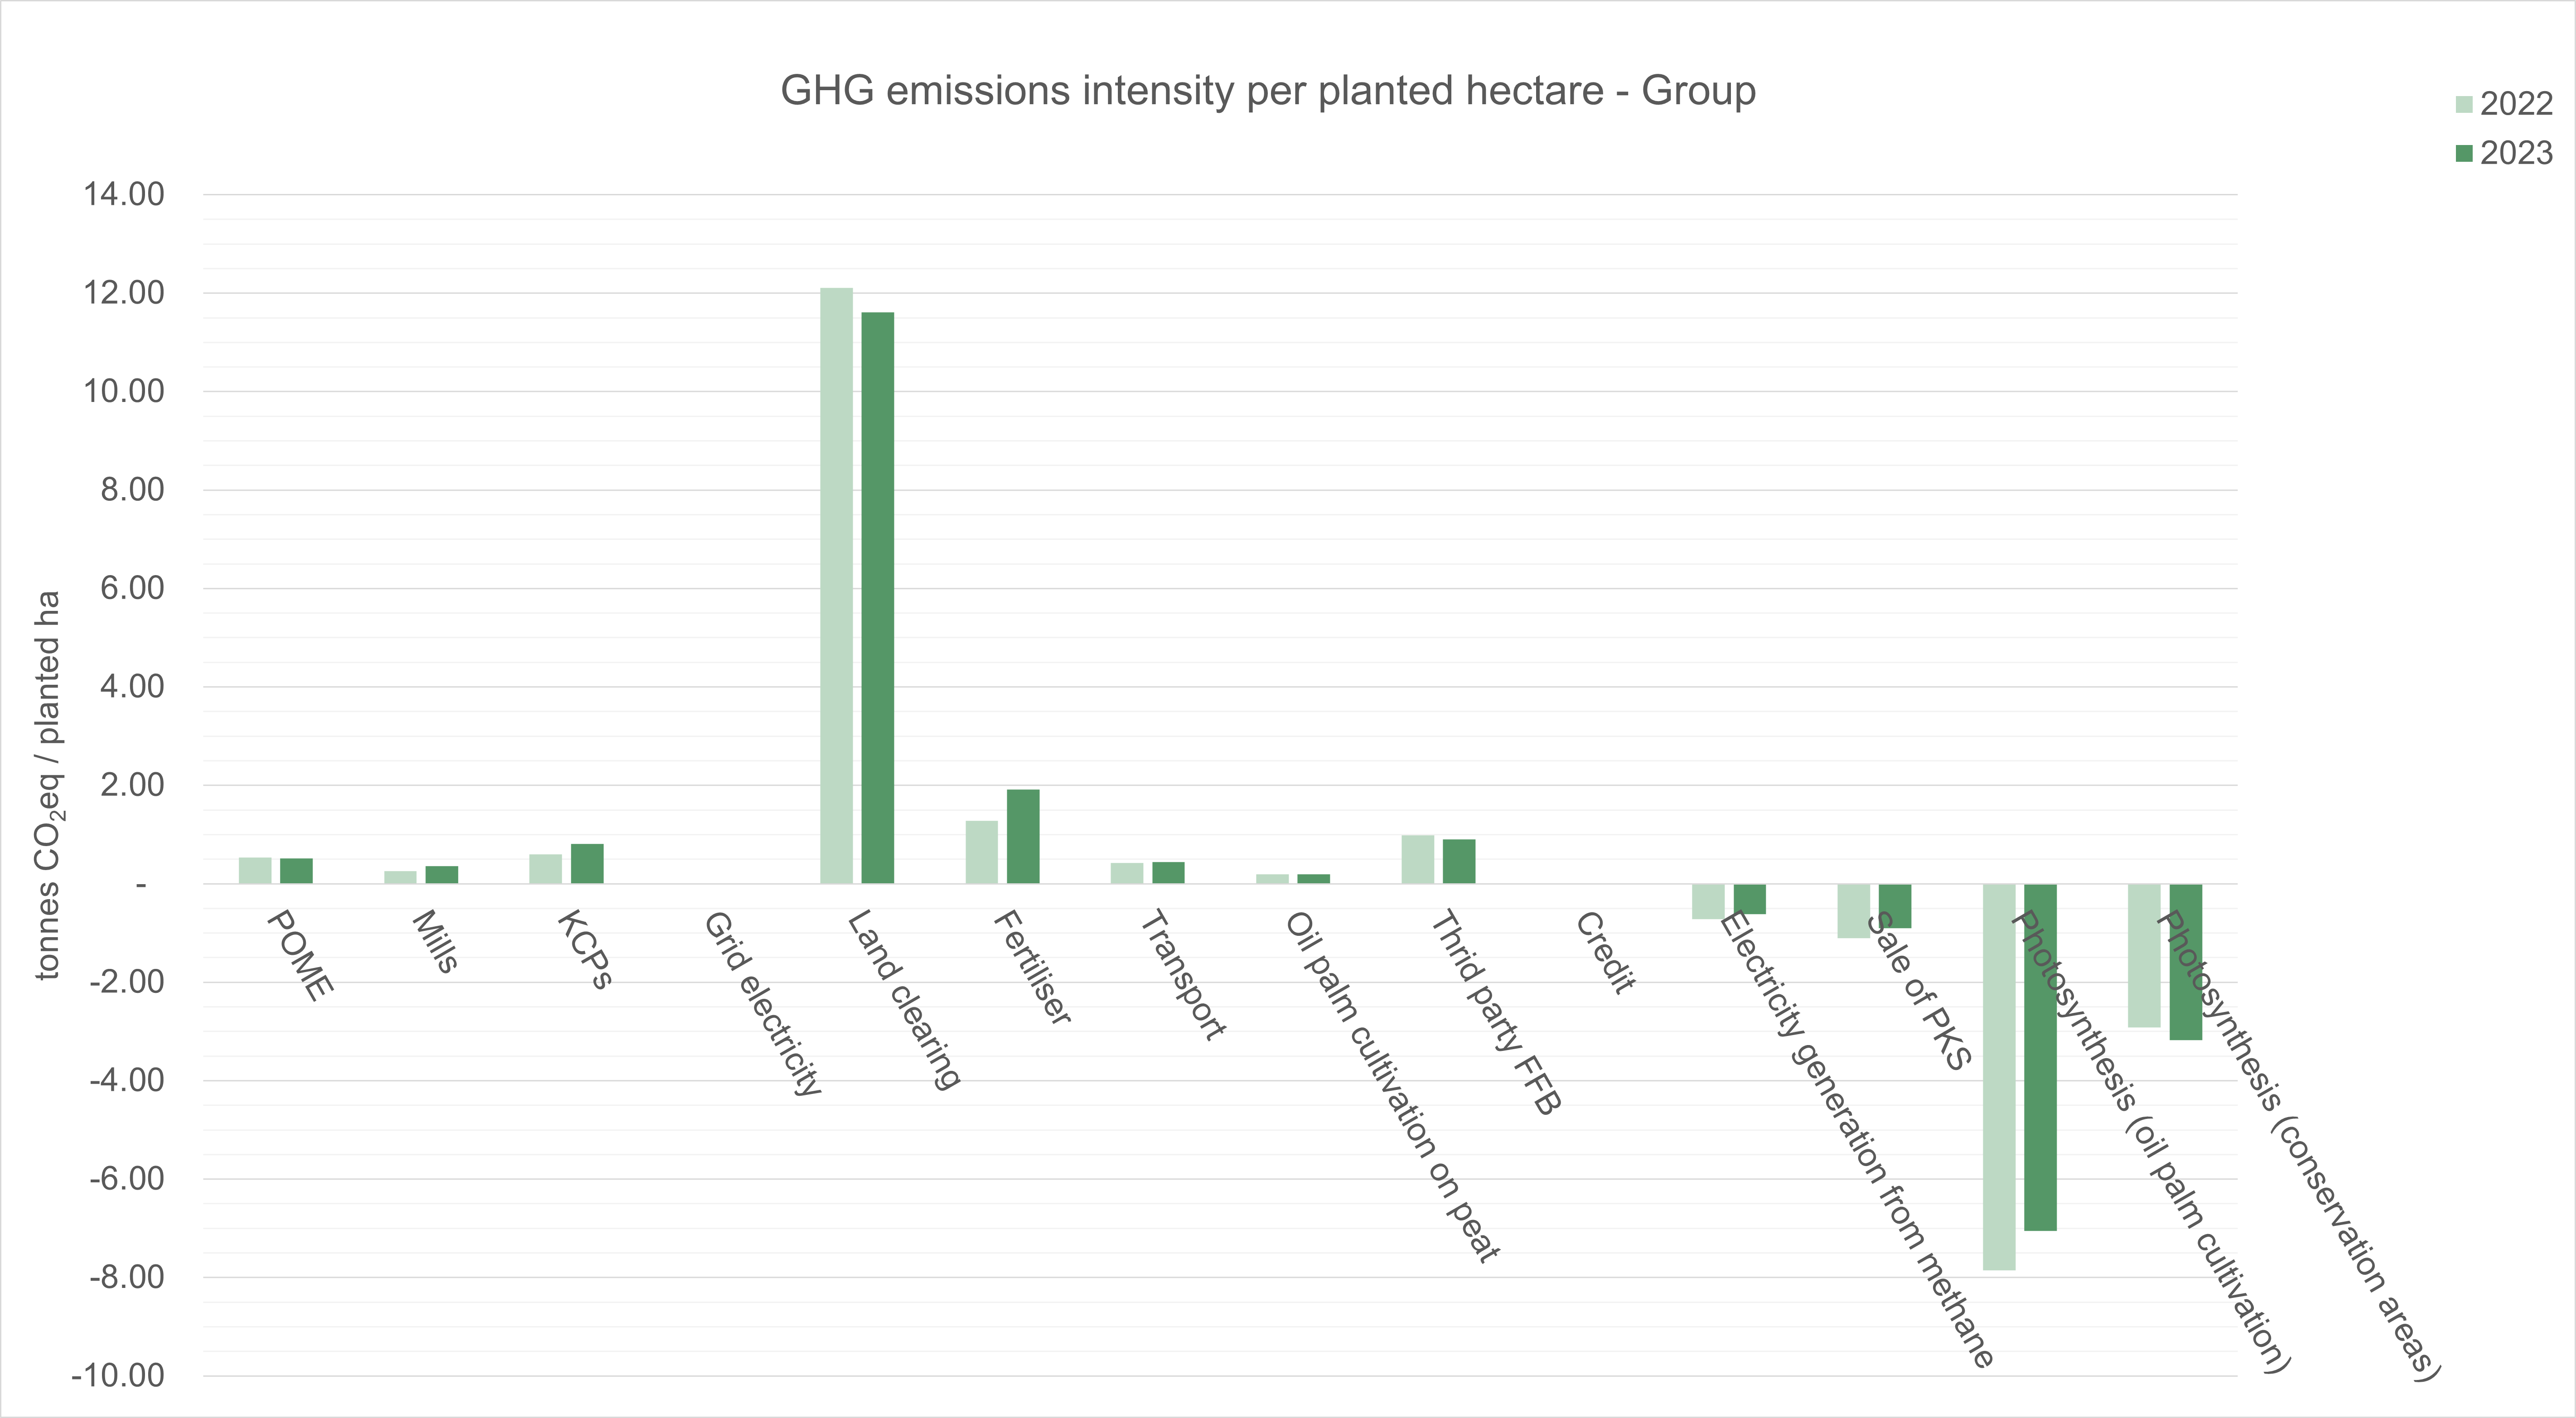
| Gross emissions / planted hectare | 18.02 | 17.79 |
| Gross emissions / tonne of CPO produced | 2.94 | 2.80 |
| Net emissions / planted hectare | 3.41 | 2.13 |
| Net emissions / tonne of CPO produced | 0.56 | 0.34 |
|
1 Covers Scope 1 direct GHG emissions from historic land conservation, agricultural practices and peat soil
2 Covers Scope 3 indirect GHG emissions including those associated with the extraction, production and transport of purchased materials such as fertilisers and pesticides, as well as fuel usage by third contractors involved in operations 3 Covers Scope 1 and 3 emissions from the transport and processing of crop and waste products. Conversion factor used to calculate energy use from combustion of fuel is 10.58kWh/litre diesel (Source: UK government GHG Conversion Factors for company reporting 2020) 4 Covers Scope 2 emissions associated with electricity usage in group offices in both Indonesia and the UK, representing indirect GHG emissions from the consumption of purchased electricity as defined by the GHG protocol 5 Calculated using the group’s palm oil emissions data |
||
RSPO PalmGHG standard
REA has been monitoring and reporting its carbon footprint using the PalmGHG tool for over ten years and currently uses the latest version (version 4) of the PalmGHG tool which became mandatory for RSPO members on 1 January 2020. The PalmGHG tool was developed by a multi stakeholder group within RSPO which included leading scientists in the field of GHG accounting for oil palm operations. Annual reporting of emissions using the PalmGHG tool has been mandatory for all RSPO members since 2016, with submissions independently verified by RSPO accredited certification bodies. REA also reports emissions for both ISCC and ISPO using a different calculation methodology.
The PalmGHG tool uses a lifecycle assessment approach, whereby all of the major sources of GHG emissions (carbon dioxide (CO2), methane (CH4) and nitrous oxide (N2O)) linked to the cultivation, processing and transport of oil palm products are quantified and balanced against carbon sequestration and GHG emission avoidance. All direct, and the majority of indirect, emissions associated with the group’s oil palm operations in Indonesia are captured within the PalmGHG tool. Changes in the calculation methodologies of the various versions of the PalmGHG tool as it has developed mean that there are variations in the calculation of emissions from year to year.
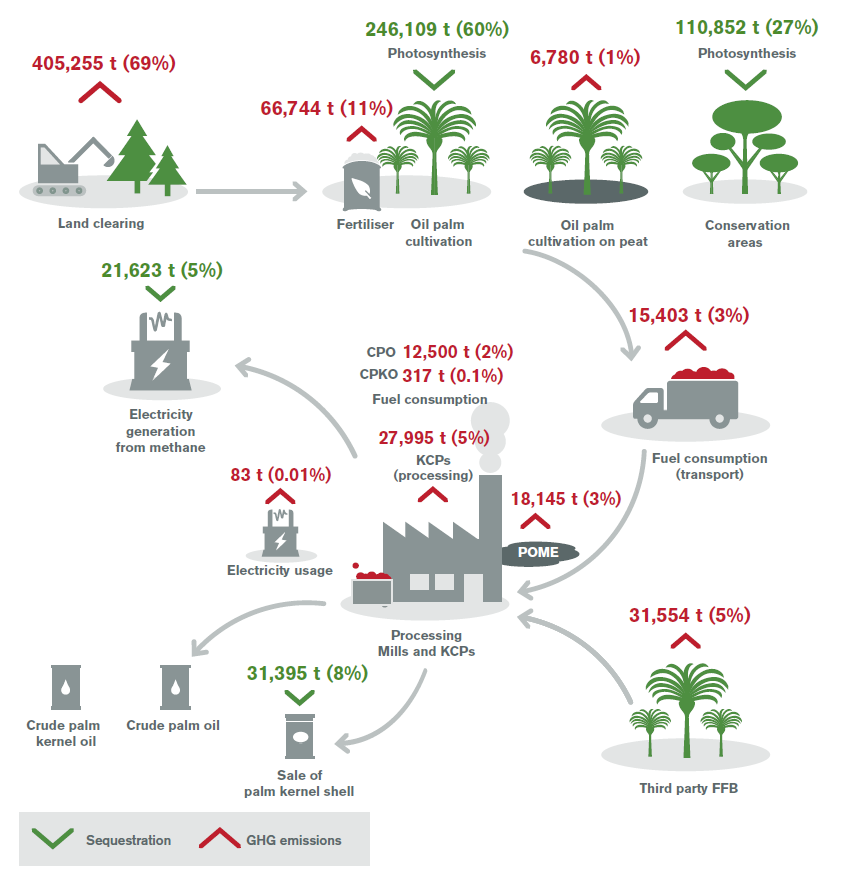
REA applies two measures to its evaluation of the intensity of its GHG emissions: net GHG emissions per tonne of CPO produced and net GHG emissions per planted hectare (immature and mature). Both intensity measures are considered relevant because the maturity of the oil palm within the supply base does not influence the trend in GHG emissions per planted hectare, whereas it does impact the GHG emissions per tonne of CPO. Net GHG emissions in 2023 show a 64.7% increase against 2022 when expressed per tonne of CPO produced and a 60.1% increase when expressed per planted hectare. REA’s long term strategy is to reduce emissions by focusing on decarbonisation and carbon insetting.

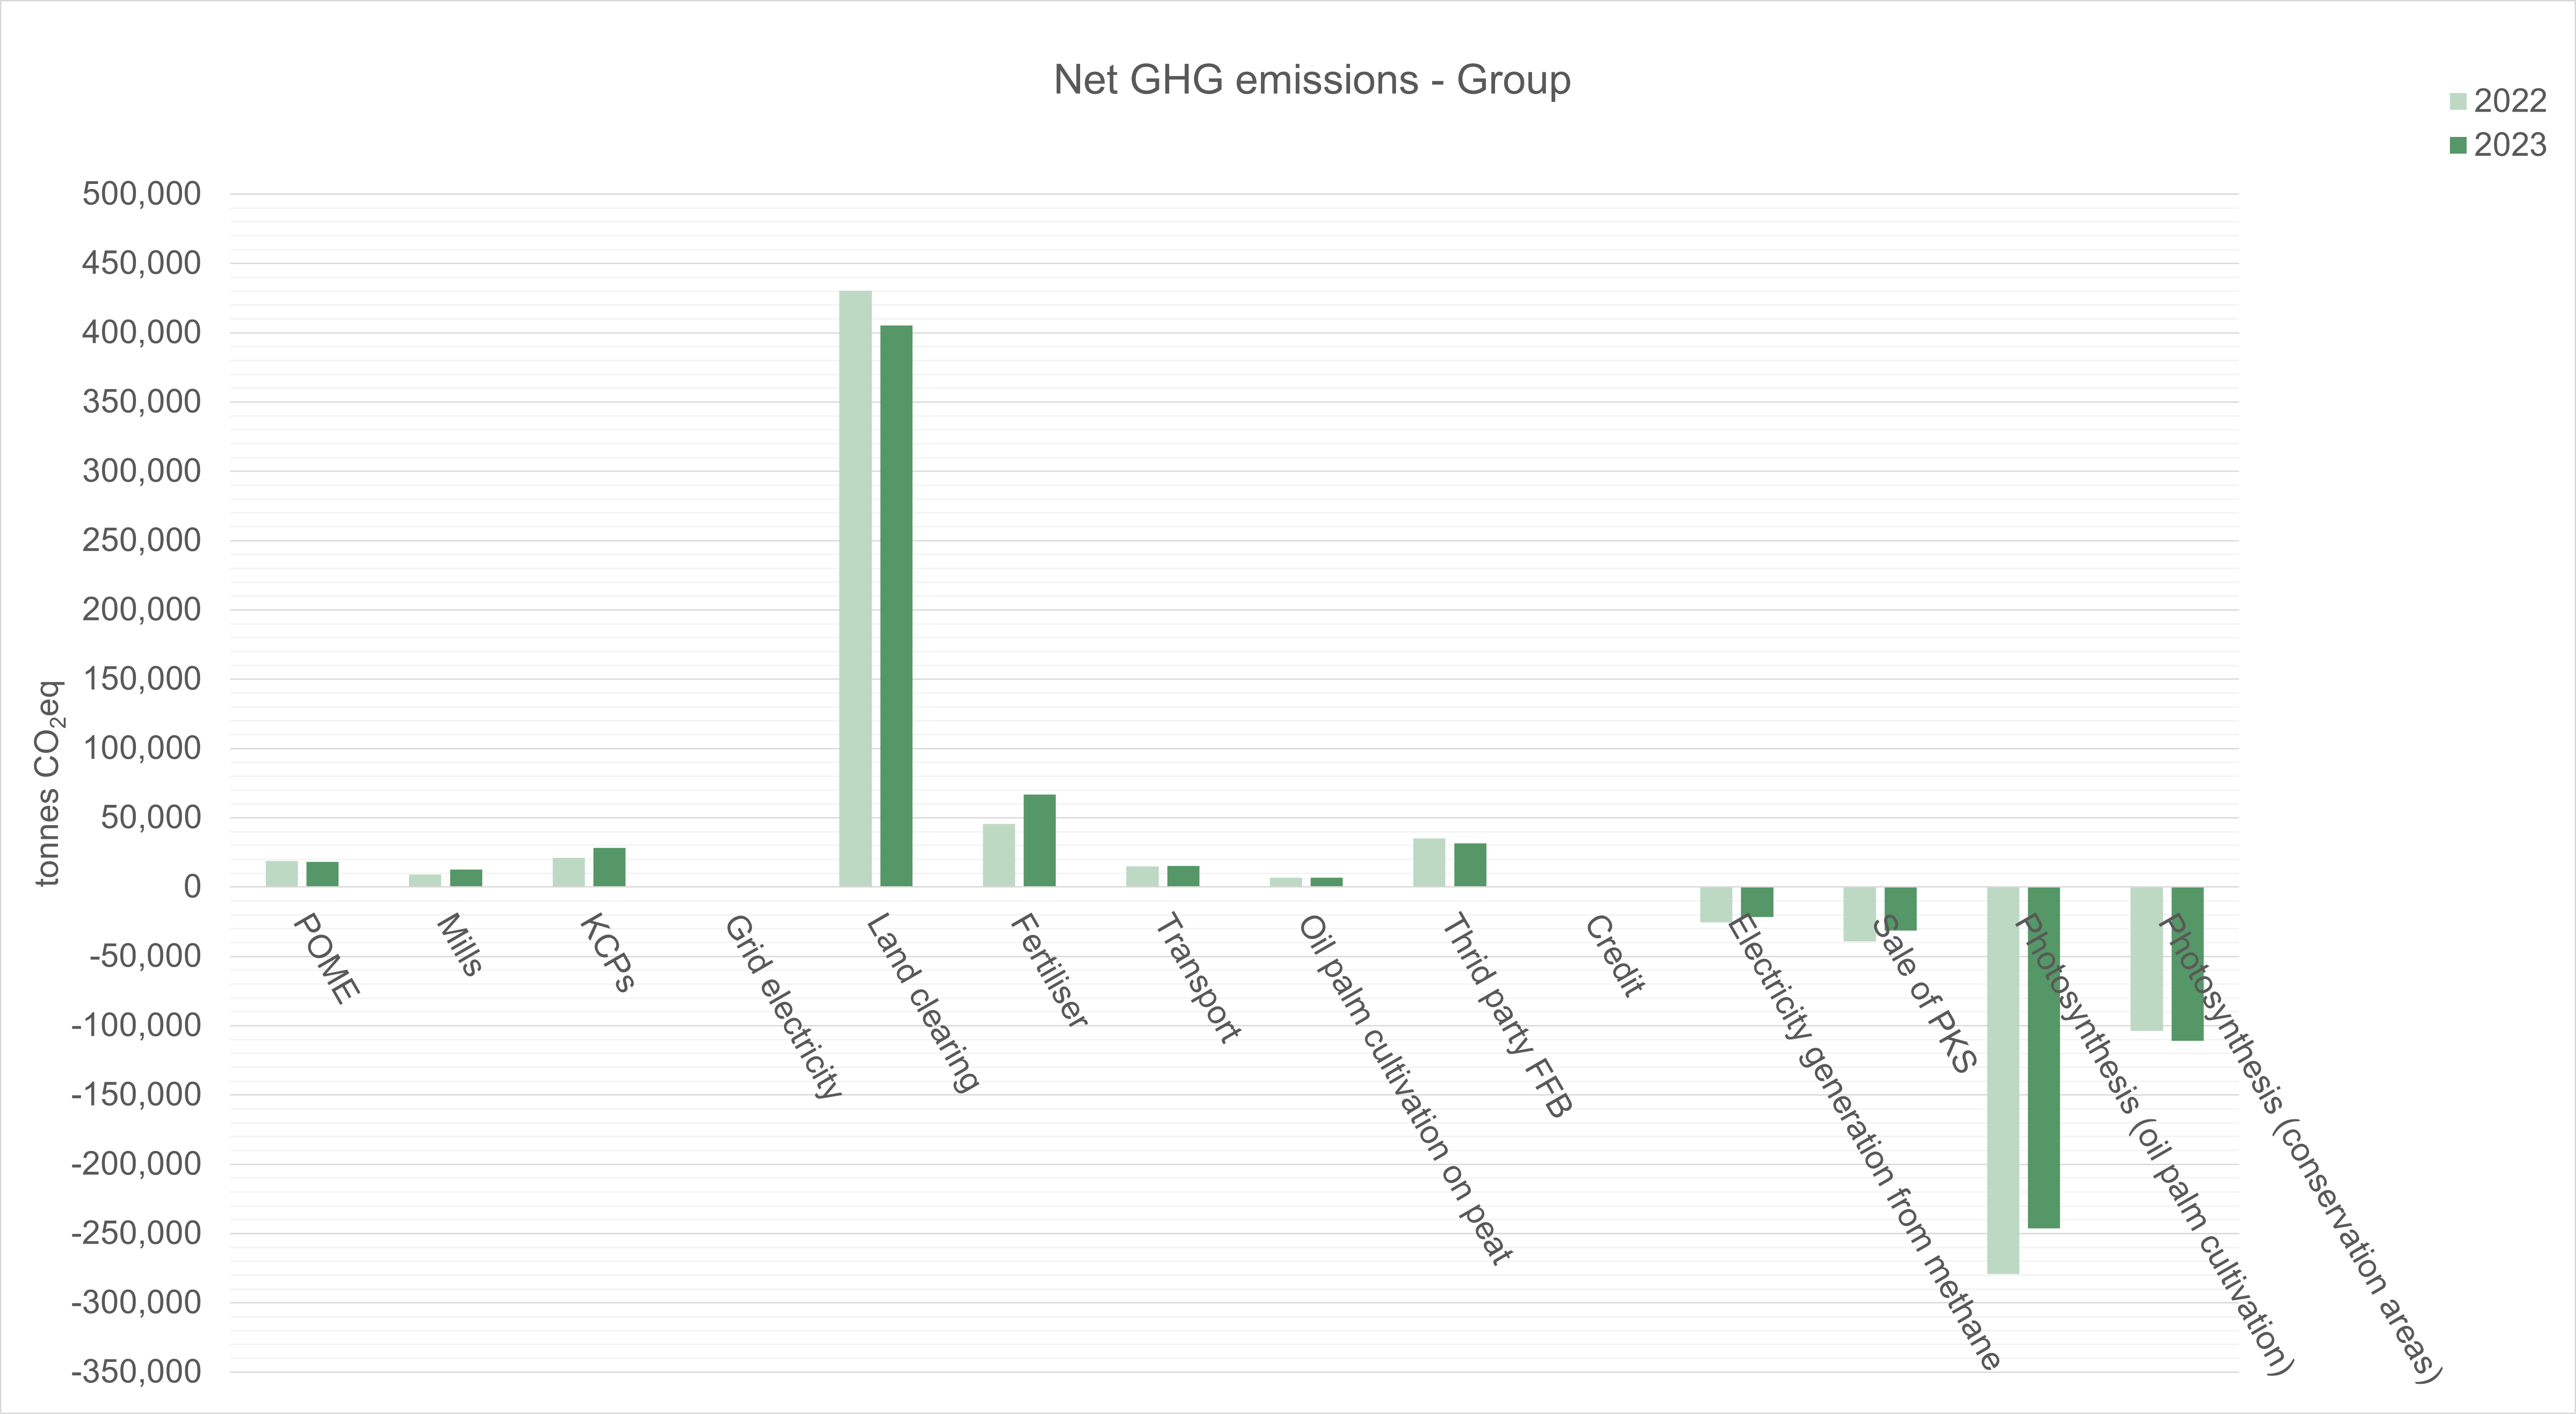
Gross GHG emissions associated with REA’s oil palm operations were overall 1.6%lower in 2023 compared with 2022. Within the overall total, gross emissions associated with crop collection, milling and palm product distribution increased by 6.0% in 2023 due to the higher consumption of diesel fuel for processing crops.
Net GHG emissions are calculated by deducting from the gross GHG emissions the carbon that is estimated to have been fixed (sequestered) by the oil palms and conserved set-aside forest through the process of photosynthesis. A further deduction is made to account for the GHG emissions that have been avoided as a result of the use of renewable electricity from REA’s methane capture facilities in domestic buildings and by local communities that were previously supplied with electricity from diesel powered generators. As a result, net emissions are substantially lower than gross emissions. However, in 2023, net GHG emissions were 67.8% higher than in 2022 because of the development and new planting in PU, increased fertiliser application, and the replanting of the group’s mature areas.


For more detailed information on the calculation of GHG emissions on an individual mill basis, click here.
International Sustainability and Carbon Certification (ISCC)
Since 2012 REA has also been reporting GHG emissions under the ISCC system which uses a different calculation methodology and for which annual emissions calculations are independently verified by an ISCC accredited certification body. ISCC is a globally applicable sustainability certification system which covers sustainable feedstocks including, amongst others, agricultural and forestry biomass.
The ISCC requirements regarding GHG emissions apply to all relevant supply chain elements from raw material production to the distribution of the final product, including cultivation, all processing steps, and transport and distribution of intermediate and final products. The calculation methodology follows the requirements of the Renewable Energy Directive 2009/28/EC amended through Directive (EU) 2015/1513 (RED) and Fuel Quality Directive 2009/30/EC amended through Directive (EU) 2015/1513 (FQD)1. The RED2 allows economic operators to calculate actual GHG emission values, to use default values or to use a combination of disaggregated default values and calculated actual values. In this calculation, REA chooses to use the actual value calculation method for all stages of the process. REA must be able to prove and justify that the resultant GHG emissions calculations represent all emissions from its production process. Calculated GHG emissions are submitted annually to an ISCC accredited Certification Body for auditing, verifying and approval as part of REA’s annual ISCC recertification process.
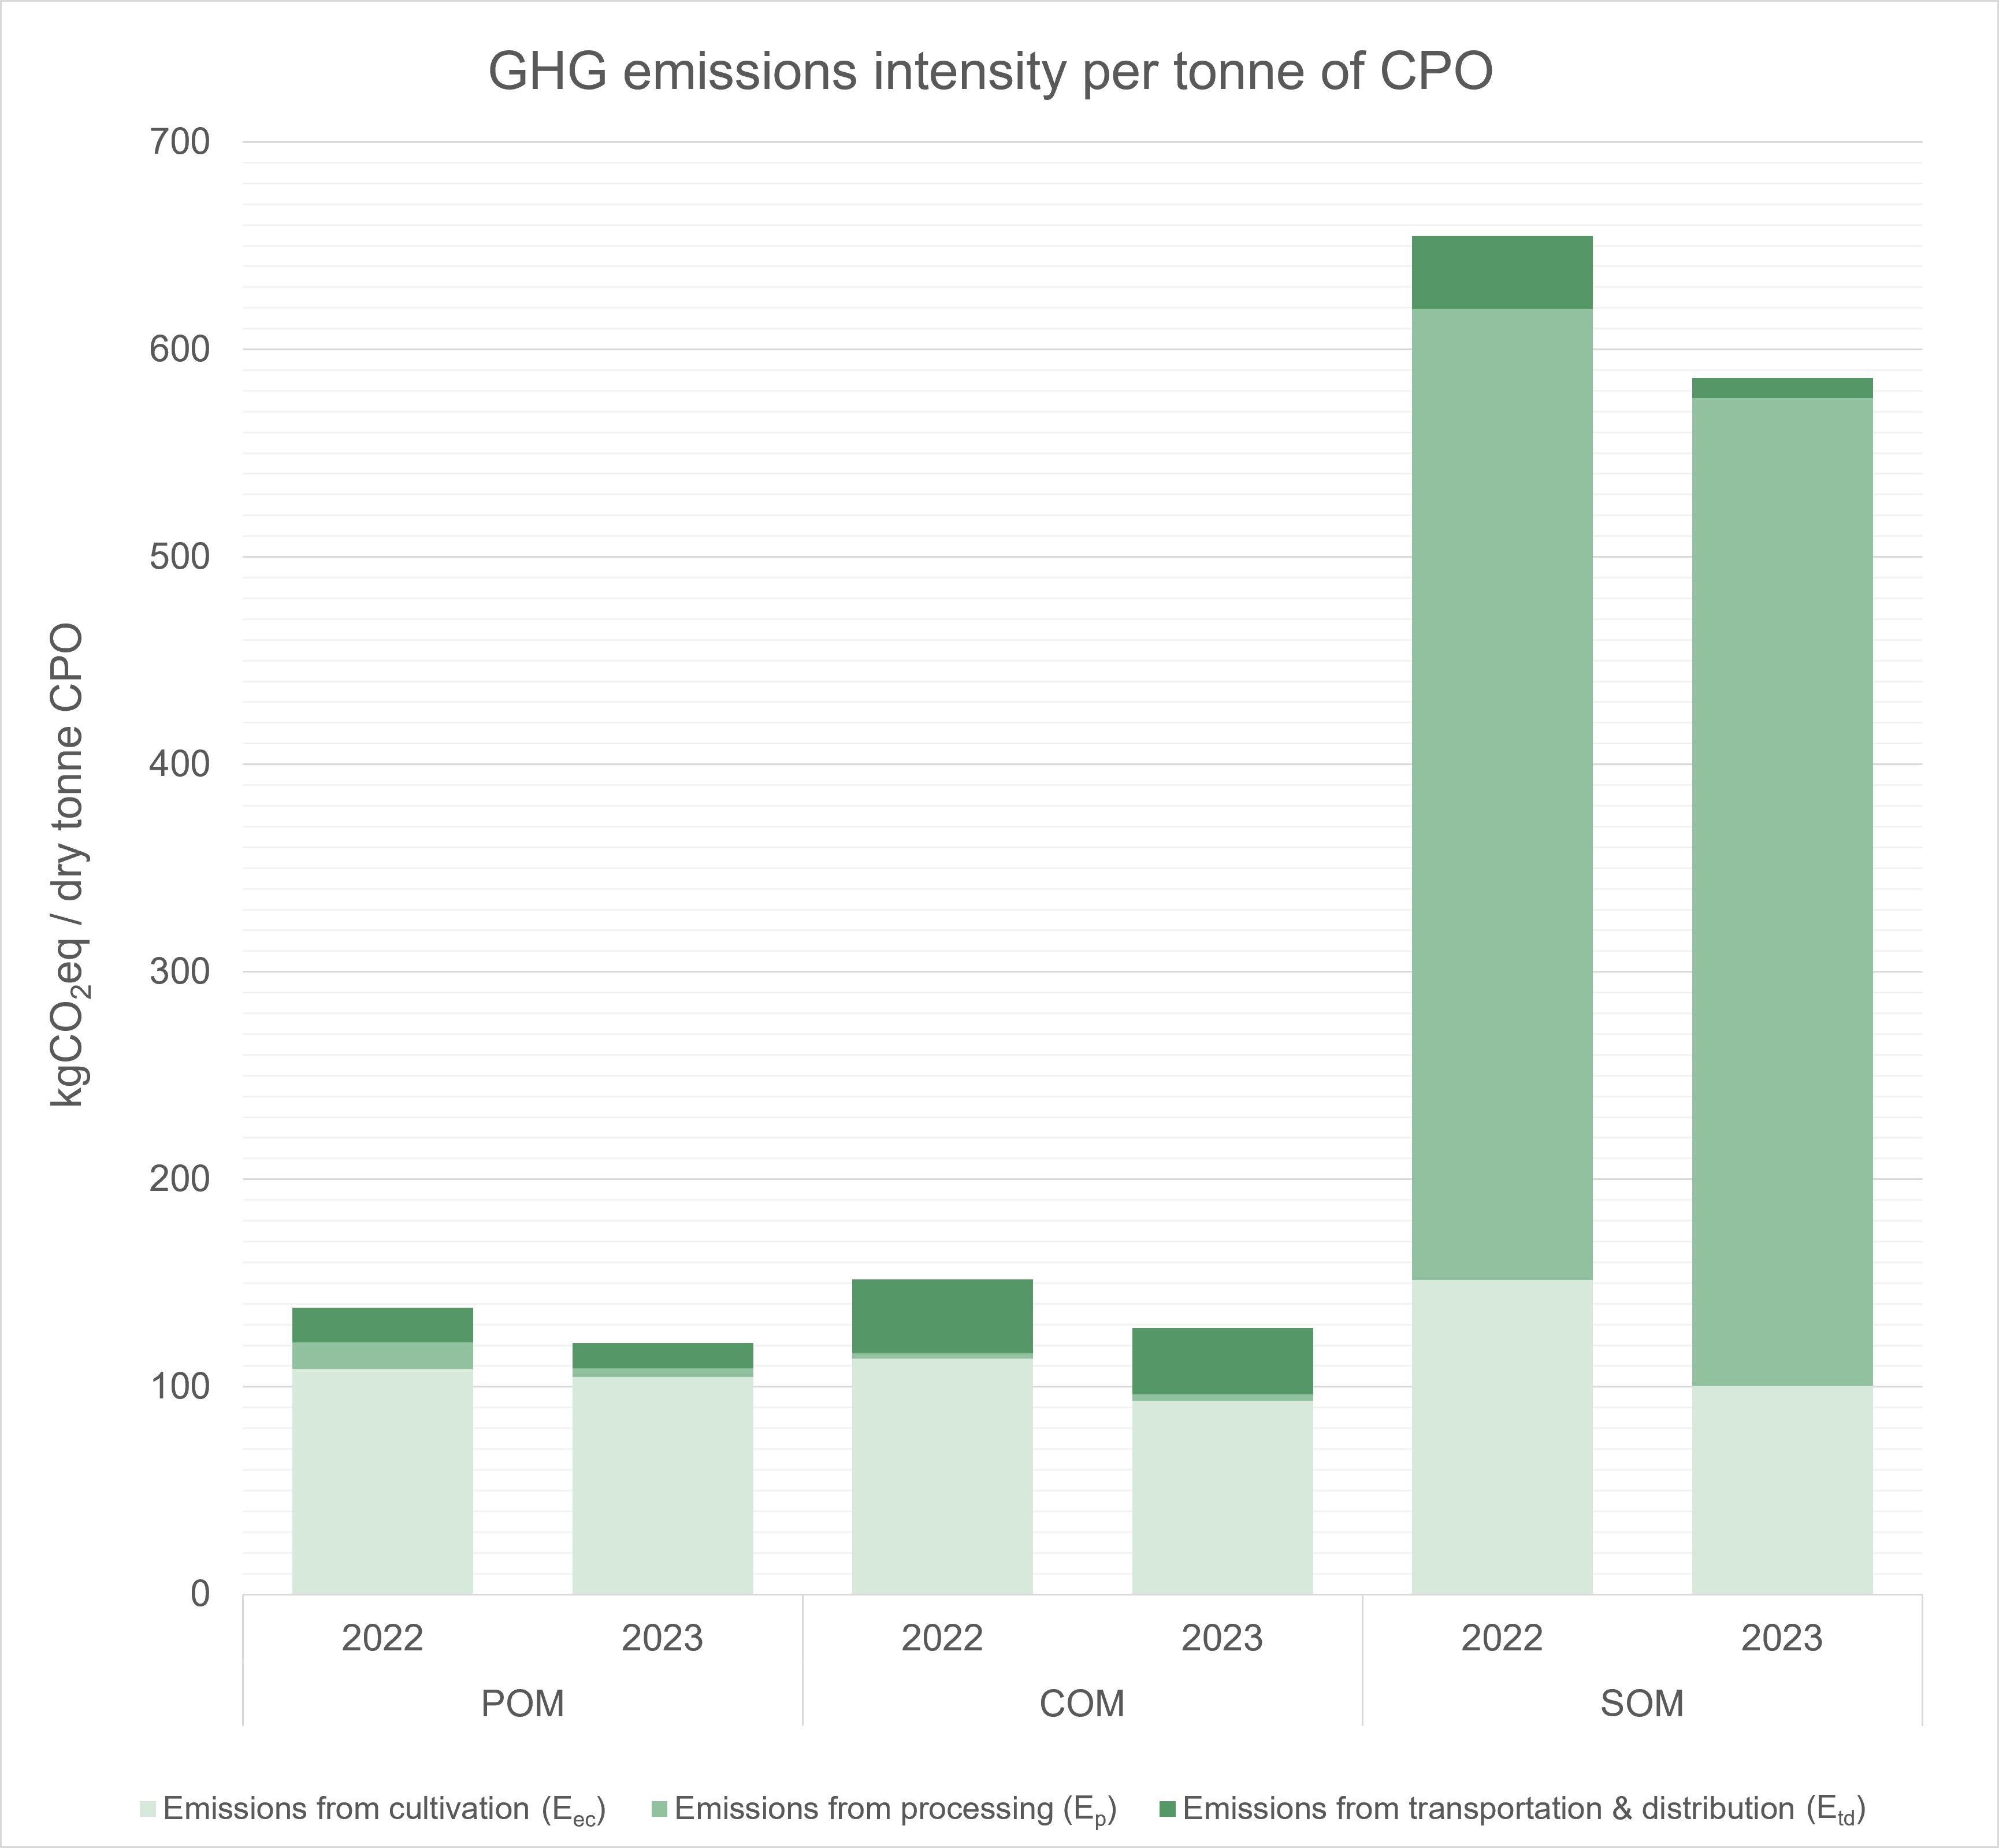
Overall, REA’s total net emissions decreased by 12% in 2023, taking account of all elements of emissions.
This increase is influenced by changes in the provisions of the ISCC referring to the Renewable Energy Directive 2009/28/EC amended through the Renewable Energy Directive (2018/2001/EC) and Fuel Quality Directive 2009/30/EC amended through Directive (EU) 2015/1513 (FQD)1 (RED II) whereby excess electricity from methane capture is no longer counted as an emission credit and there is a change in the coefficient on the emission factor and feedstock factor.
In 2023, reported emissions from cultivation decreased by 20% compared with 2022. For the same period emissions from processing were nil and emissions from transportation and distribution decreased by 39%.

REA has prepared intensity reduction targets for GHG emissions for 2023–2025.
This involves the identification of all sources of emissions and carbon sequestration (scope 1 and 2) that specifically affect the balance of GHG emissions. REA uses the gross emissions value (total GHG emissions resulting from the operational activities of plantations and palm oil mills) as the indicator of the GHG emission reduction target.
The emission sources that have been identified are shown in the table below, together with the emissions reduction targets for 2023–2025.
| Sources | Gross emissions value (tCO2eq) | Emissions intensity (tCO2eq / tFFB) | Emissions intensity (tCO2eq / tCPO) | Emissions intensity (tCO2eq / Ha planted) | Increase / (Decrease) (%) | |||||||||
| 2023 | 2024 | 2025 | 2023 | 2024 | 2025 | 2023 | 2024 | 2025 | 2023 | 2024 | 2025 | 23/24 | 24/25 | |
| Emissions sources | ||||||||||||||
| POME | 44,120 | 41,032 | 39,391 | 0.04 | 0.04 | 0.04 | 0.18 | 0.18 | 0.17 | 1.24 | 1.15 | 1.11 | (0.07) | (0.04) |
| Mill fuel consumption | 10,881 | 10,119 | 9,715 | 0.01 | 0.01 | 0.01 | 0.05 | 0.04 | 0.04 | 0.31 | 0.28 | 0.27 | (0.07) | (0.04) |
| Grid electricity utilization | 105 | 98 | 94 | 0.00 | 0.00 | 0.00 | 0.00 | 0.00 | 0.00 | 0.00 | 0.00 | 0.00 | (0.07) | (0.04) |
| Land conversions | 439,644 | 408,869 | 392,514 | 0.43 | 0.39 | 0.38 | 1.84 | 1.80 | 1.74 | 12.37 | 11.50 | 11.04 | (0.07) | (0.04) |
| CO2 from fertilizer | 34,341 | 31,938 | 30,660 | 0.03 | 0.03 | 0.03 | 0.14 | 0.14 | 0.14 | 0.97 | 0.90 | 0.86 | (0.07) | (0.04) |
| N2O from peat | 818 | 818 | 818 | 0.00 | 0.00 | 0.00 | 0.00 | 0.00 | 0.00 | 0.02 | 0.02 | 0.02 | 0.00 | 0.00 |
| N2O from fertilizer | 27,659 | 25,723 | 24,694 | 0.03 | 0.02 | 0.02 | 0.12 | 0.11 | 0.11 | 0.78 | 0.72 | 0.69 | (0.07) | (0.04) |
| Field fuel consumption | 12,860 | 11,959 | 11,481 | 0.01 | 0.01 | 0.01 | 0.05 | 0.05 | 0.05 | 0.36 | 0.34 | 0.32 | (0.07) | (0.04) |
| Peat oxidation | 5,963 | 5,963 | 5,963 | 0.01 | 0.01 | 0.01 | 0.02 | 0.03 | 0.03 | 0.17 | 0.17 | 0.17 | 0.00 | 0.00 |
| Third party FFB suppliers | 31,909 | 29,675 | 28,488 | 0.03 | 0.03 | 0.03 | 0.13 | 0.13 | 0.13 | 0.90 | 0.83 | 0.80 | (0.07) | (0.04) |
| Chemicals for WTP | 0.35 | 0.33 | 0.31 | 0.00 | 0.00 | 0.00 | 0.00 | 0.00 | 0.00 | 0.00 | 0.00 | 0.00 | (0.06) | (0.06) |
| Lubricant | 176 | 164 | 157 | 0.00 | 0.00 | 0.00 | 0.00 | 0.00 | 0.00 | 0.00 | 0.00 | 0.00 | (0.07) | (0.04) |
| Inputs - herbicides & pesticides | 797 | 741 | 711 | 0.00 | 0.00 | 0.00 | 0.00 | 0.00 | 0.00 | 0.02 | 0.02 | 0.02 | (0.07) | (0.04) |
| KCPs | 40,730 | 37,879 | 35,711 | 0.04 | 0.04 | 0.03 | 0.17 | 0.17 | 0.16 | 1.15 | 1.07 | 1.00 | (0.07) | (0.06) |
| Total gross emissions | 650,004 | 604,978 | 580,398 | 0.63 | 0.58 | 0.56 | 2.72 | 2.66 | 2.57 | 18.29 | 17.02 | 16.33 | (0.07) | (0.04) |
| Credits sources | ||||||||||||||
| Export of excess electricity to housing & grid | (26,365) | (24,520) | (23,539) | (0.03) | (0.02) | (0.02) | (0.11) | (0.11) | (0.10) | (0.74) | (0.69) | (0.66) | (0.07) | (0.04) |
| Sale of palm kernel shell | (27,444) | (25,523) | (24,502) | (0.03) | (0.02) | (0.02) | (0.11) | (0.11) | (0.11) | (0.77) | (0.72) | (0.69) | (0.07) | (0.04) |
| Crop sequestration | (246,265) | (229,026) | (219,865) | (0.24) | (0.22) | (0.21) | (1.03) | (1.01) | (0.97) | (6.93) | (6.44) | (6.19) | (0.07) | (0.04) |
| Conservation sequestration | (121,732) | (121,732) | (121,732) | (0.12) | (0.12) | (0.12) | (0.51) | (0.54) | (0.54) | (3.43) | (3.43) | (3.43) | 0.00 | 0.00 |
| Total credits | (421,807) | (400,801) | (389,639) | (0.41) | (0.38) | (0.37) | (1.76) | (1.76) | (1.73) | (11.87) | (11.28) | (10.96) | (0.05) | (0.03) |
| Net emissions | 228,197 | 204,177 | 190,759 | 0.22 | 0.19 | 0.18 | 0.95 | 0.90 | 0.84 | 6.42 | 5.74 | 5.37 | (0.11) | (0.07) |
CarbonSpace’s digital carbon MRV platform
REA is working with CarbonSpace’s digital carbon MRV platform to calculate the net ecosystem exchange, or estimate the greenhouse gas emission flows relating to land use change in the company’s oil palm operations and supply chains (scope 3). The platform will ensure data accuracy and granularity of REA’s supply chain carbon reporting aligned to the group’s net zero goals. CarbonSpace’s dMRV platform has third-party system-level verification in accordance with ISO14064-3, conducted by Control Union. CarbonSpace monitoring results are eligible for carbon accounting across the major standards, such as ISO14000s, the GHG Protocol and SBTi’s FLAG Guidance.
REA has collected primary data on gross biogenic removals across the group’s supply chains using the CarbonSpace MRV tool. The tool uses the flow accounting approach in accordance with the GHG Protocol Land Sector and Removal Guidance. Flow accounting focuses on an estimation of GHG flows by sink or source processes. It takes account of both short and long term carbon cycles associated with removals, usage and storage of carbon. Introducing the flow accounting approach has allowed REA to evaluate the short-term climate cooling effect of the group’s production and supply bases.
By using this reporting system, REA can more accurately assess the impact of sourcing activities, monitor the carbon sequestration and emissions of the group’s plantations and supply bases, and thence work with suppliers to improve and maintain their environmental performance.
CarbonSpace’s dMRV tool has been applied to 5,814 polygons in REA’s supply bases (inti and plasma estates, affiliated and independent smallholders) representing an area of 76,018.4 hectares. The period of monitoring was from 2019 to 2023.
Across all monitored land, the 5 year average Net Ecosystem Exchange (NEE) was -842,332 tCO2 (-11.1 tCO2 per hectare) to gross biogenic carbon removal, or net carbon sequestration, from the atmosphere into agricultural products and ecosystem carbon pools. In 2023, NEE was -826,438 tCO2 (-10.9 tCO2 per hectare), which is lower than the average.